JULES MEJIA

DATA ANALYSTWelcome to my Data PortfolioPython | SQL | Power BI


PROJECTS

Securing an NBA Contract

Capstone Project
Used multiple linear regressions to identify 5 key insights that will inform an NBA player what skills he can improve to secure his next NBA contract.

Ecommerce Database Analysis

SQL Project
This project simulates a real world scenario where people from different areas of the business are seeking data to understand the impact of their decisions.

A New Builder in
King County WA, USA

Python Project
Used multi-linear regression to identify 5 key variables with a strong relation to house price. This will serve as a blueprint for a residential builder to build suitable housing.

Microsoft's New Movie Studio

Python Project
Used visualisations to communicate 3 key insights to inform Microsoft and their new movie studio how to be competitive in a saturated market.

Inventory Management

An ongoing project with Tayabas Community Hospital. Through data analysis, the hospital aims to identify weak points in their system and improve their processes.More details to come.


SKILLS & CERTIFICATIONS


You can reach out to me at any time through email julespmejia@gmail.com or
through a direct message on my LinkedIn.
Need an independent contractor?
Contact me through my business, Linya Aus, at linya.aus@gmail.com

MY WHY

My ongoing passion for basketball started from day 1 when I was 11 years old. I felt that same spark of passion on day 1 of discovering data analytics. Slowly, I learned that being a data analyst involves collecting, organising, understanding and telling a story. To my surprise, it is the same process I use to understand the world around me.My view of the world and how it can be represented in data is why I decided on a career in data analytics.Combined with my 9 years of experience in engineering, I'm committed to being a great data analyst and solve problems using data. I offer a detailed and mindful approach that translates data into real action and insights.My portfolio is a reflection of my data journey so please enjoy it.I also want to mention, that behind my ambition, I appreciate the support and the sacrifice of those close to me. A big thank you to my family, friends and especially my amazing wife. I would not have this opportunity for a career change without any of you. I am forever grateful.

Securing an NBA Contract

Through exploratory data analysis and linear regression of real data, this report will generate 3 key insights that will inform an NBA player what skills he can improve to secure his next NBA contract.I chose a data set and business problem centred around basketball because I am a long time fan of the game. My domain knowledge both on paper and on court will serve as an advantage as I understand the nuances of this analysis.

business problem

An up and coming NBA trainer would like to create a training program for NBA players, specifically rookies and final year contract players looking to extend their NBA career and get another contract from the 2023-24 NBA season and beyond.The aim is to identify insights from the 2022-23 NBA season that will inform areas of focus for the player's training program.The model generated will be based on prediction, maximising the effect of the co-efficients so that a player can secure the biggest possible contract.

data understanding

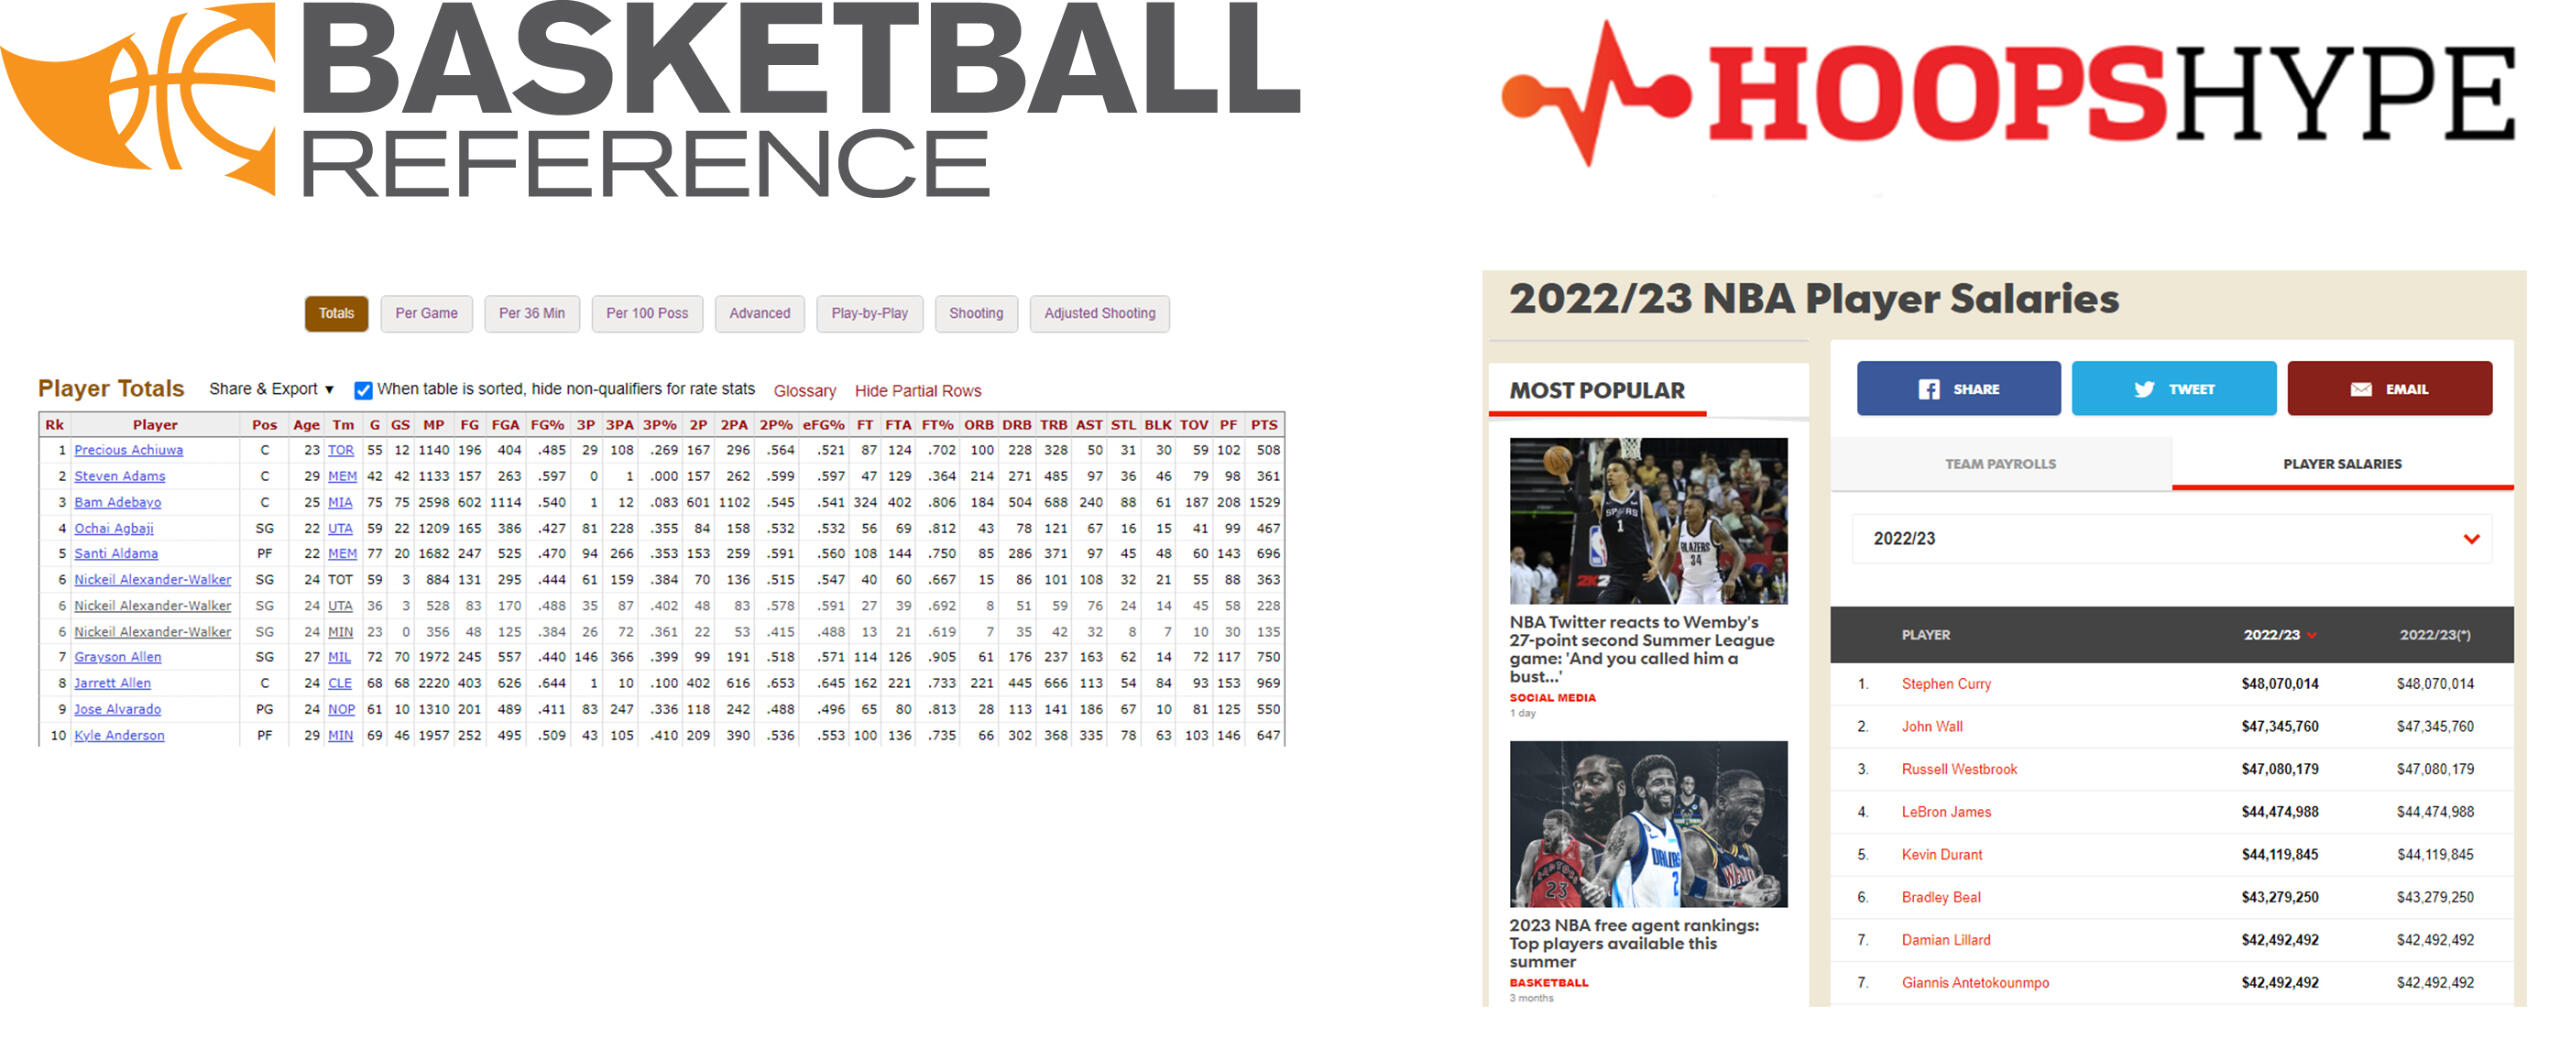
The data for this project is sourced from Basketball Reference and Hoops Hype. Both websites are trusted and reputable sources for NBA statistics and news. The data is taken from the 2022-23 season to represent current trends in the NBA.The 2022-23 season data set from Basketball Reference provides a wide variety of stats for each player that can be conveniently downloaded as a .csv. The data collected include:Totals
Per Game
Advanced
Play-by-Play
Shooting
Adjusted Shooting
The player's salary is web scraped from the 2022-23 NBA Player Salaries webpage on Hoops Hype.

method

The initial plan for data analysis was to join all the different counting and advanced stats into one data set. From there, I wanted to identify the stats that correlated strongest with the dependent variable, salary. However, with each subsequent iteration, high multicollinearity remained present. This is a given since the structure of the data set is highly correlated to begin with.Why is the data set highly correlated? Click here for a quick explanation into how advanced stats are derived.Each stat is important in describing a player's tendendcies but end up being highly correlated data. Therefore it was difficult to observe the true effect of the co-efficients and the statistical significance.In order to reduce multicollinearity, a model was created for each data set. Since high correlation still remains, instead of declaring which independent variables have the strongest effect on salary, it would be best to identify a trend across all models.

analysis

Below are the scatter plots of each model with variables that are statistically significant and high co-efficients.Click here for a detailed breakdown of the analysis.

conclusion

I suggest a player focus on these aspects to secure an NBA contract.1 - Improve 3 point shooting percentage or be an off ball threat for easy 2 point shots
2 - Use playing time to win the game, not to accumulate individual stats
3 - Avoid offensive rebounds and steals. Stay within the team offence and defence structure

further improvements

Every model exhibited high multicollinearity and is leptokurtic (heavy tails, more outliers). I would like to investigate how sport statistics manage their data for analysis or investigate other regression models. It was not covered in this course but I would incorporate VIF scores and see the effect on identifying multicollinearity.I would also expand the rows in the data by including data from previous seasons, as far back as 5 seasons. A one season data set contained large variance and after transformations, the rows reduced dramatically. A larger data set could balance the variance and address the outliers.

Securing an NBA Contractadvanced stats

A counting stat represent tangible actions a player accumulates during a game. An example would be field goal percentage (FG%)FG% = FG / FGAFG includes all shots made (2pt and/or 3pt) therefore all columns based on FG will be correlated.An advanced stat uses a modifier together with counting stats to understand the effect of a tangible action. An example would be effective field goal percentage (eFG%). eFG% captures scoring efficiency per field by giving weight to the number of field goals made by 1.5 if the field goal made is a three point attempt.eFG% = (FG + 0.5 * 3P) / FGA

Securing an NBA Contractanalysis breakdown

Based on the counting stats (the first 2 scatter plots), a player that can get defensive rebounds, score many points or generate many assists. This is very broad as any player should work on these parts of the game all the time. What is a more interesting to observation is that offensive rebounds, steals and 2 point shots do not contribute to salary. This is reflective of the current playstyle of the NBA. Offensive rebounds and steals often places individual players out of position on defence which can hurt the overall team defence. 2 point shots, generally from mid-range also places players out of position on offence.Based on the advanced stats (the last 4 scatter plots), it is difficult to quantify defence however it was shown here that defence or offence is not more important than each other, as long as the player contributes win shares. This is also supported by the minimal effect that the plus minus stats have. In general, the way a player plays should contribute to wins and that will bring a bigger contract.For example a player that scores 20 points and their team has a positive win percentage will be perceived as more valuable than a player that scores 25 points per game but their team has a negative win percentage.The final question is what can a player improve on offensively to secure the next big contract? The shooting advance stats show that True Shooting (TS) is most valuable. In essence, a player that has a high effective field goal percentage (eFG%) AND can get to the free throw line. As the other advanced shooting stats suggest, it is not about how many shots a player attempts but more about making the shot and staying efficient. The player should focus on making shots close to the rim (dunks and layups) and any 3 point shot. If the player is not an effective 3 point shooter, an alternative is being an off ball threat to score 2 points.

Microsoft's new movie studio

Through data analysis, this report will generate 3 key insights to inform Microsoft and their new movie studio how to be competitive in a saturated market.It is important to communicate visually and provide context to help Microsoft understand the large amount of data that is available to them. Finally, I will provide a recommendation based on the analysis I have generated.

business problem

Microsoft is exploring options to expand the services they provide. Given the success of other large corporate competitors in the video content space, Microsoft have decided to open their own movie studio. Given the lack of experience in an industry dominated by well-established brands, it is important to identify key metrics that Microsoft can build upon.An important aspect for any business entering into a new industry is building an identity. What can Microsoft implement to differentiate themselves from their competitors? I have broken it down into 3 overarching directions:1 - Playing The Numbers - Maximise viewership by building upon genres that are trending
2 - Familiar Faces - Audiences will be attracted to people that have had long term success in the industry
3 - Stories Are Our Strength - Success is defined by being critically acclaimed and it begins with stories
For the purposes of this project, I will focus on insights regarding Playing The Numbers.

data understanding

The data being used for this analysis have been gathered from well-known websites IMDb, Rotten Tomatoes and TMDB. Each website collects a large amount of information regarding movies in their own way including financial data, review scores and genre. Casting a wide net of data sets will provide a balanced insight, reflective of a big population given the size of the movie industry.

analysis

For my analysis, I will identify the top 3 genres for each insight. My recommendation will be based on identifying the genre that performed best across all insights.

INSIGHT 1

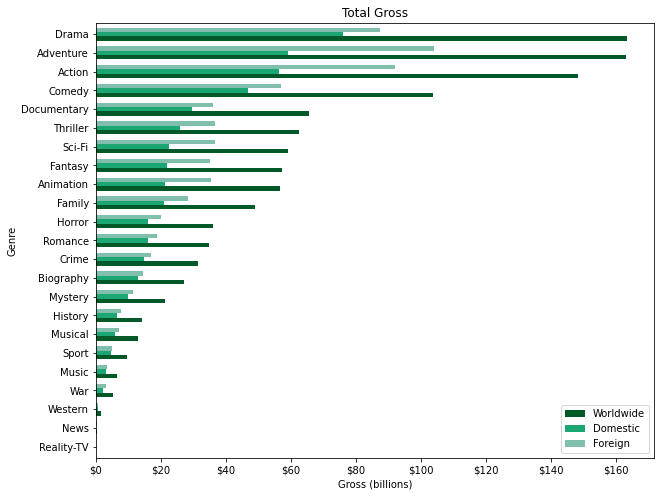
A simple and great insight to start off with would be to explore which genre had the highest gross. The underlying concept here is that high gross sales equates to more people have viewed that genre of movie.The top 3 by worldwide gross sales are Drama, Adventure and Action.I have included the Domestic and Foreign and Gross numbers because the movie being produced should reach a global audience. For every genre, worldwide gross numbers were greater than the Domestic gross numbers. A movie that appeals to both the domestic and worldwide audience can go a long way into the final gross numbers.

INSIGHT 2

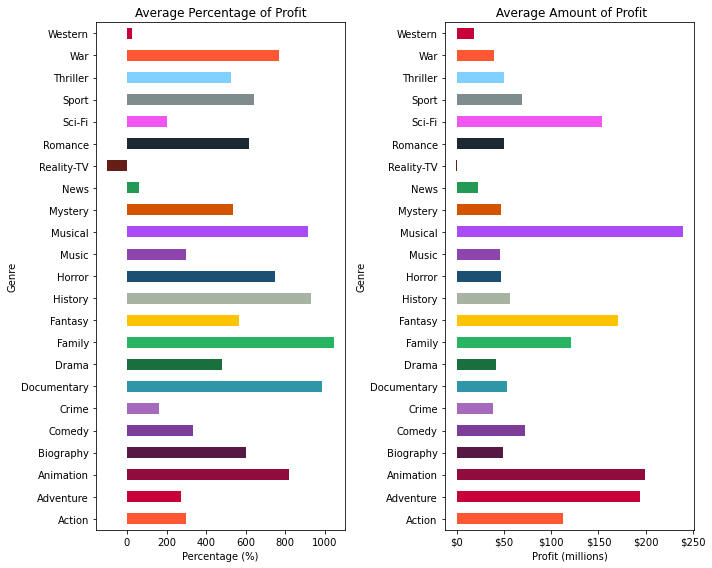
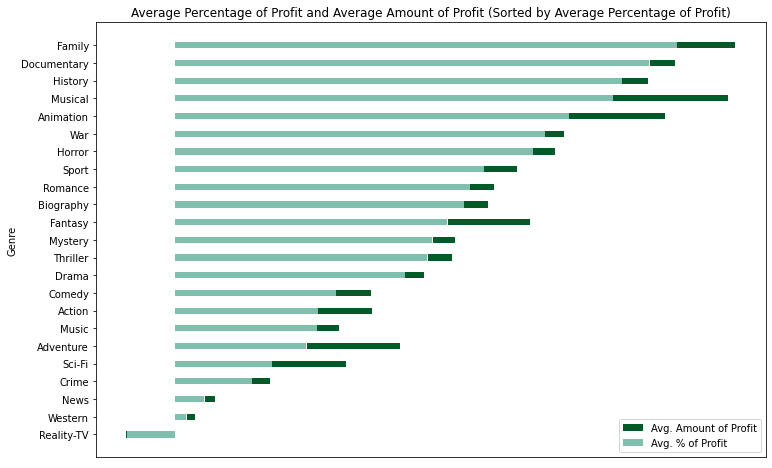
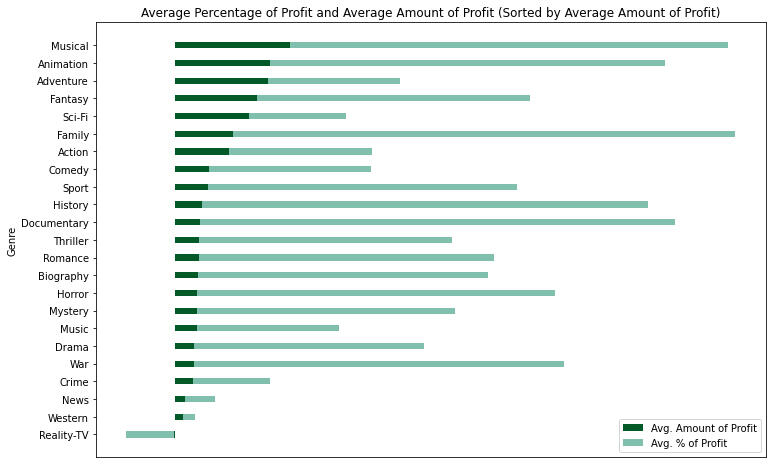
For a new studio, a reasonable budget is an important consideration. Pouring all available resources into a project is enticing but that does not guarantee a movie from flopping. In these early stages, a flop would hurt Microsoft's reputation both in the short and long term.I modelled two graphs to identify the relationshop between budget and the profitability for each genre.The Average Percentage of Profit graph indicates each genres ability to generate profit based on their budget. For example, if an action movie had a budget of $1 million, it would be able to produce 300% of profit which equates to $3 million. Therefore, a genre like musicals with a higher percentage can have a lower budget to reach the same profit.However, a high Average Percentage of Profit does not automatically mean it will generate high profit. The Average Amount of Profit graph shows how much profit each genre actually made.Below are a combination of the graphs to better visualise the top 3 performing genres.

The top 3 genres by Average Percentage of Profit are Family, Documentary and History. In general, these movies usually have a lower budget. By having a lower budget, these genres have higher potential to generate profit.The top 3 genres by Average Amount of Profit are Musical, Animation and Adventure.

INSIGHT 3

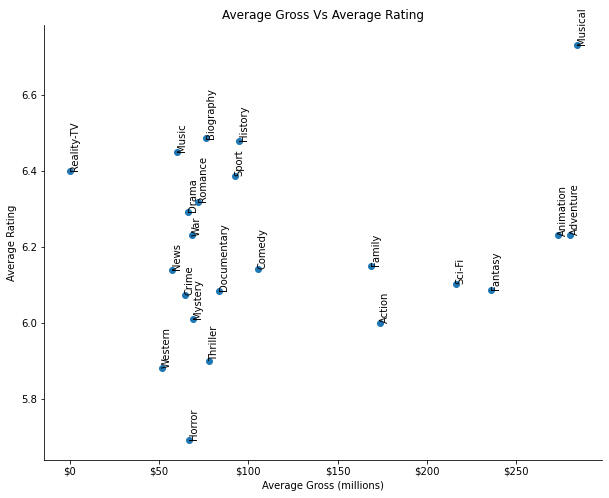
One of the many considerations moviegoers use to make the decision to watch a movie is its rating. Generating well rated movies could generate new/repeat viewers leading to higher gross/profit. It will also support the strong sales displayed in insight 1 and generate long term success.The Average Gross Vs Average Rating graph helps identify which genres do both well and the top 3 are Musicals, Adventure and Animation.

conclusion

These are the top performers for each insight.INSIGHT 1:
Drama, Adventure and Action
INSIGHT 2:
Family, Documentary and History and
Musical, Animation and Adventure
INSIGHT 3:
Musical, Adventure and Animation
Based on these results, it is
my recommendation that Microsoft's newest studio release an Adventure movie.
While an Adventure movie requires a higher budget and has an average rating, the overwhelmingly larger volume of sales outweigh better budgeted and better rated genres. Relying on the strength of sales will minimise risks.A surprising and well performing genre is musical. The total gross sales are in the bottom third but has great potential to generate profit and rate very well with audiences. If the studio is able to generate enough popularity for a musical movie, it could do very well.Genres to avoid would be war and westerns. They do not perform well in any insight and are era specific. They most likely appeal to a small proportion of the wider audience.
further exploration

I would like to explore the strength of covariance and correlation between the insights I have generated. It would provide a deeper context and allow the studio to be more confident in the direction they choose. When the studio makes a decision on a genre, the next insight to explore would be when in the year it would be best to release it.Furthermore, given the extensive amount of data available, I would like to explore the other 2 overarching directions I mentioned at the beginning of this project, Familiar Faces and Stories Are Our Strength. Actors, directors and story all play a part in the production of a movie and I would like to explore how that relates to gross sales, budget and ratings.

A New Builder inKing County WA, USA

Through exploratory data analysis and linear regression, this report will generate 3 key insights that will aid in the decision making of a residential builder looking to make a presence in King County.It is important to understand the relationship each variable has with price so the residential builder can have a blueprint for their designs.

business problem

A residential builder based in the USA has had much success on the east coast. They are looking to expand their market into the west coast of the USA, starting in King County, Washington.The aim is to generate a blueprint of a house based on 5 architectural features that influence price in King County.The model generated will be based on inference rather than prediction. I want to identify which features have a strong relationship with house price and see their effect.

data understanding

This dataset comes from Kaggle. It contains houses that were sold between 2014 and 2015 in King County, Washington. There are 21,597 entries containing a wide variety of information including features of the house (number bedrooms, bathrooms), location (zipcode, latitude, longitude) and ratings (view, grade).

method

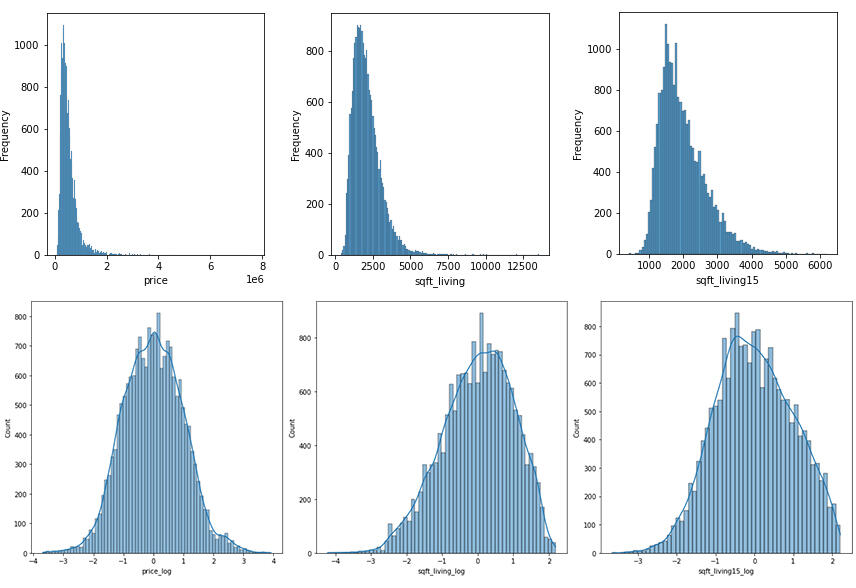
An iterative approach was used for regression modelling to better understand the effect of architectural aspects of a house in relation to the price. Each iteration went through transformations in order to validate the linearity assumptions, address multicollinearity and reduce variance. These transformations included dropping variables with a weak correlation score and linear relationship, logarithmic transformations and mean normalisations to boost the performance of the model and reducing the data to within 2 standard deviations to address overfitting of the model.The figures below show the initial conditions of the variables and the result after transformations.

analysis

Using sklearn's feature selector the top 5 variables that have a strong relationship with the target variable price are:grade_11
grade_12
bathrooms_3.75
view_3.0
view_4.0
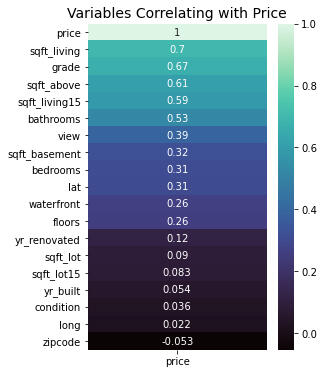
During each iteration, the P-values held true with the correlation heat map. This provided me with great confidence that the correct variables were being chosen to be used in the model.Additionally, it is important for data to synergise well with real world application. The top 5 variables are realistic in the sense that a typical person would consider these architectural features when evaluating the price of a house.

conclusion

In order for the residential builder to be successful in King County, they must consider:1 - Creating a custom design using high quality materials, high quality finish work and luxurious optionsThe results Grade 11 and 12 sit on the higher end of the ranking system and is reflective of the model that has been produced. Investing in an excellent builder, high quality materials and luxurious options will yield a higher house price.2 - Incorporating 3 or more bathrooms into their designsBased on the statistical significance of the number of bathrooms throughout the iterations, it was observed that the number of bathrooms only started having a strong relationship with price at 3. Again this is reflective in the results at 3.75. The results suggest that many of the higher priced homes have a minimum 3 bathrooms.3 - Choosing a location of the house with a great view of local points of interestThe features of the home are not the only important factors in raising the price of a house. The location is just as important and in this case, if the house has a view. King County has a variety of landmarks, ocean, lake and views. Opting to build a house within view of these natural and manmade points of interest will have a positive effect on the price.

Sharing my data journey on social media.More content to come in the future.

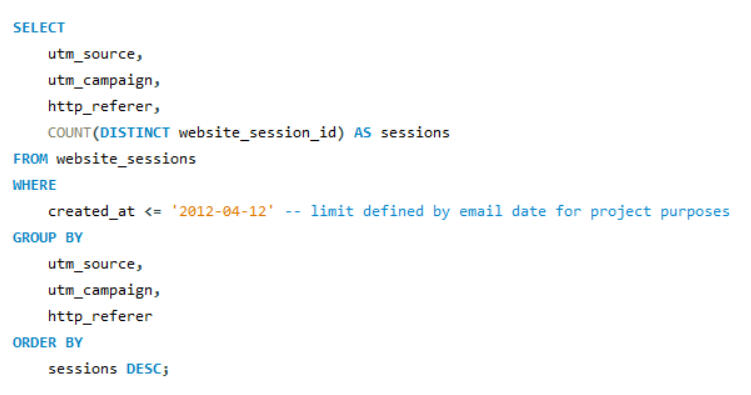
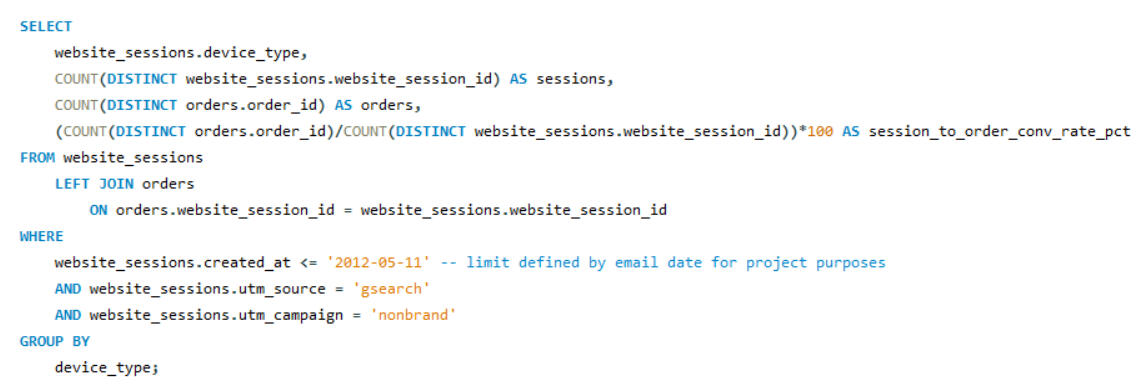
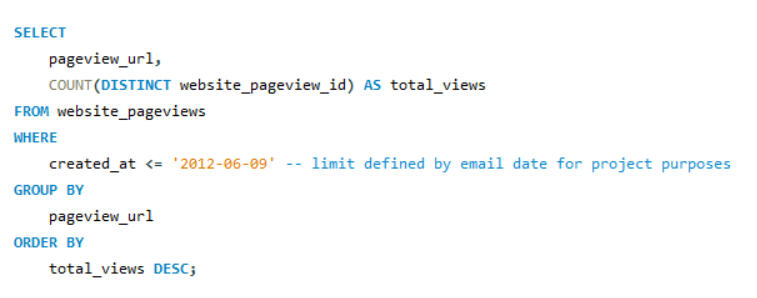
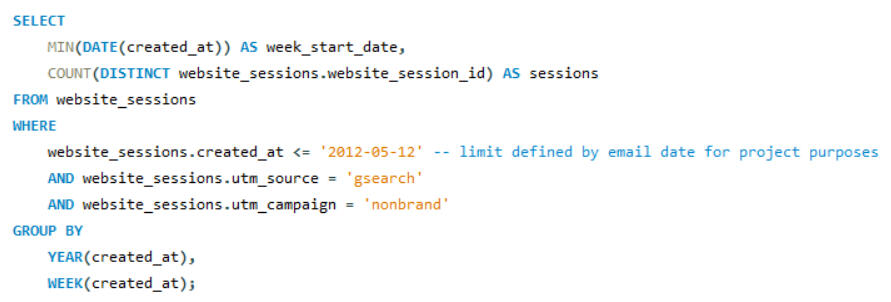
Maven Fuzzy FactoryeCommerce Database Analysis

The CEO, Head of Marketing and the Website Manager of the Maven Fuzzy Factory would like to better understand how the business is performing across various metrics.As an analyst, I will use SQL techniques like Aggregating, Joins, CASE Pivoting, Temporary Tables and Subqueries to deliver insights that will support stakeholder decision making.This project simulates a real world scenario where people from different areas of the business are seeking data to understand the impact of their decisions.